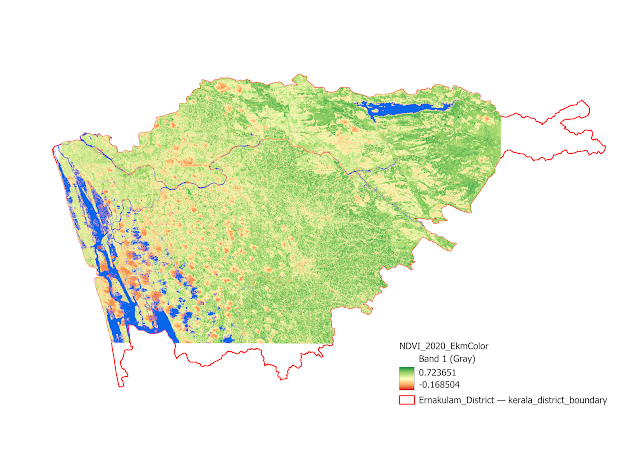
Vegetation changes detection plays a critical role in
understanding urban expansion, ecological degradation, and climate resilience. Here
I explore the Normalized Difference Vegetation Index (NDVI) for Ernakulam
District, Kerala, using Sentinel-2 satellite imagery for the years 2020 and
2025. The objective is to detect areas of vegetation gain, loss, or stability,
and to generate clear visual and quantitative indicators to support future
environmental planning.
Data Sources
- Satellite Imagery: Sentinel-2 Level-2A imagery (10 m resolution) from Copernicus Open Access Hub @ 10% cloud cover.
- Bands Used:
- Band 8 (NIR - Near
Infrared)
- Band 4 (Red)
Methodology
- NDVI Computation NDVI was calculated for both 2020 and 2025 using the formula:
NDVI
=
Computation was done in QGIS
using the Raster Calculator.
- Clipping
and Masking NDVI rasters were clipped using the Ernakulam district
mask to focus the analysis within administrative boundaries.
- NODATA
Handling Areas without data (e.g., outside district boundary or cloud
cover) were assigned a NODATA value (-9999) using the 'Build Virtual
Raster (VRT)' tool with masking.
- NDVI
Rendering Visual interpretation was improved by applying a pseudocolor
ramp:
NDVI < 0: built-up or water
(Red)
0.0–0.2: sparse vegetation
(Yellow)
0.2–0.4: moderate vegetation
(Light Green)
0.4: dense vegetation (Dark
Green)
- Change
Detection A raster layer showing difference between 2025 and 2020 was
created:
NDVIchange
= NDVI2025 – NDVI2020
- Threshold
Classification NDVI changes were categorized:
Gain: > +0.05
Loss: < -0.05
Binary masks were generated for each category.
- Water
Body Isolation Pixels with very low NDVI were mapped to highlight
major water bodies (e.g., Lakes, streams, dam storage) using a custom
mask.
Visual Outputs:
Figure 2: NDVI condition in 2025 |
 |
Figure 3: Changes: Composite map showing greening
(blue-green), loss (magenta), and stable zones (neutral green) |
These visuals help observe spatial patterns: urban fringe
vegetation loss, greening in north-eastern hills, and stable agricultural
areas.
This NDVI-based approach reveals useful trends in greenness. With
additional zoning, socio-economic, or temperature overlays, this framework can
evolve into a powerful climate-resilience diagnostic for Kerala districts.
 |
| LST map of Kerala District-wise (by the Author) |


No comments:
Post a Comment